散点图 Sample详情
最后更新时间:2019年6月17日
直角坐标系上的散点图可以用来展现数据的 x,y 之间的关系,如果数据项有多个维度,其它维度的值可以通过不同大小气泡来表现,也可以用颜色来表现。
1
//定义图表视图对象
private ChartView mChartView = null;

//根据MapView实例化
mChartView = new ChartView(getApplicationContext(),aMapView);
2
根据实际需求获取坐标点数据(有多种途径,可参考热力图部分数据获取方法),然后以此构建散点图数据对象。
//创建散点数据
ScatterData scatterData = new ScatterData();
//设置当前点x坐标
scatterData.setX(x);
//设置当前点y坐标
scatterData.setY(y);
//设置当前点的权值
scatterData.setDotValue(value);

//创建散点图数据序列
List<ScatterData> scatterDataLst = new ArrayList<ScatterData>();
//将散数据添加到散点数据数组
scatterDataLst.add(scatterData);
3
创建散点图图表对象,并为其设置数据等其他参数。可以创建多个散点图对象,赋予不同的数据、样式。
//创建散点图对象1
ScatterSeries scatterSerices = new ScatterSeries();
//设置散点图数据数组
scatterSerices.setScatterDataLst(getScatterDatas());
//创建默认样式
Normal normal = new Normal();
//设置默认图形的颜色
normal.setColor(Color.rgb(255, 165, 0));
//创建图形样式
ItemStyle itemStyle = new ItemStyle();
//设置默认样式
itemStyle.setNormal(normal);
//设置图形样式
scatterSerices.setItemStyle(itemStyle);
//设置图元大小
scatterSerices.setSymbolSizeByValue("value / 10");

//创建散点图对象2
ScatterSeries effectScatterSerices = new ScatterSeries();
effectScatterSerices.setScatterDataLst(getEffectScatterDatas());
ItemStyle labelItemStyle = new ItemStyle();
Normal labelNormal = new Normal();
//设置标签内容类型
labelNormal.setLabelContentType(LabelContentType.name);
//设置标签位置
labelNormal.setLabelAlignType(LabelAlignType.right);
//设置标签是否可见
labelNormal.setShow(true);
//设置标签颜色
labelNormal.setColor(Color.GRAY);
labelItemStyle.setNormal(labelNormal);
effectScatterSerices.setLabelStyle(labelItemStyle);
Normal itemNormal=new Normal();
itemNormal.setColor(Color.rgb(255, 165, 0));
ItemStyle itemStyle2=new ItemStyle();
itemStyle2.setNormal(itemNormal);
effectScatterSerices.setItemStyle(itemStyle2);
effectScatterSerices.setEffectScatter(true);
//设置图元大小
effectScatterSerices.setSymbolSize(20);
effectScatterSerices.setSymbolSizeByValue("value / 10");

//创建散点图序列,添加散点图到散点图序列
List<Series> scatterSericesLst = new ArrayList<Series>();
scatterSericesLst.add(scatterSerices);
scatterSericesLst.add(effectScatterSerices);
4
Option mOption = new Option();
option.setSeriesLst(scatterSericesLst);
mChartView.setOption(mOption);
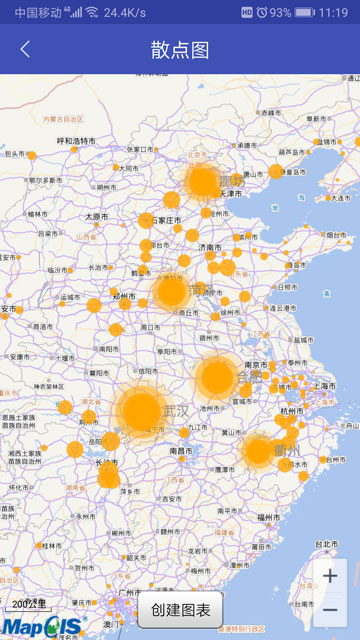
实现的散点图展示效果如下图所示: